Graph Commons: Networking and Visualizing Data for Better Insights
In data analysis and visualization processes, it is necessary to benefit from many tools. Generally, the tools and programming languages to be used may vary depending on the size and sophistication of the data set. Of course, every new tool or environment brings a learning process with it.
Sometimes working with a sample of data instead of the entire dataset can result in more effective outcomes in business management. Graph Commons is one of the successful examples that can be used for such needs.
Related article: Investigative Journalism # Graph Commons.
Graph Commons
Graph Commons is a data mapping, publishing, and analysis platform that provides both individual and collective opportunities for data transfer, analysis, and reuse. In the process of data analysis and visualization, several tools and programming languages can be utilized, depending on the size and sophistication of the data. However, Graph Commons provides a successful example of working with a sample of data rather than the whole dataset1.
Graph Commons, also known as Collective Networks, is a platform that allows users to create public or private data networks through a web page. The networks can be used for various purposes, such as research journalism, data analysis, activism, strategy development, and organizational analysis. The platform's foundation was established based on the need to vary the analysis, examination, and achieve meaningful results depending on the size of the data. Graph Commons has grown over time to host various data networks created by individuals and organizations under different categories, such as Business, Culture, and Technology.

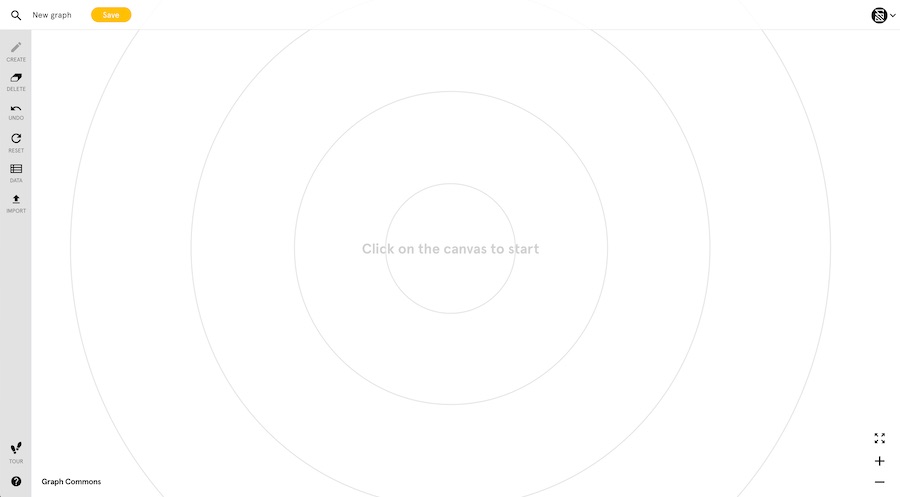
There are three methods for data input into the platform: individual data entry through the panel, batch entry through Excel, and entry via the platform's API. After entering the data, users can select the relationship types between the data nodes, categorized into four types: Interaction, Attribution, Affiliation, and Flows. The data nodes cluster, and the relationships between them become more visible, creating a data map. Additionally, users can add descriptions to each section of the map and present it in a slide format.

Graph Commons provides public and private data networks, and it could be useful to provide more information on the differences between these two types, and when it might be beneficial to use a private network over a public one. It could also be helpful to provide more details on the four categories of relationship types that can be selected when creating a data map on Graph Commons. For example, Interaction types include social interactions, communication, and other types of engagement between nodes2 3.

There are three methods for data input into the platform:
- Visual method for individual data entry through the panel
- Batch entry of data through Excel4
- Data entry through the platform's API5
When creating your network map, you can choose between four main categories of relationship types:
- Interaction
- Attribution
- Affiliation
- Flows
After entering the data and selecting the relationship types between the nodes, the data map is created by clustering and/or highlighting the connections. The created data maps can also be presented in a storytelling format. For this purpose, descriptions are added to the designated sections of the map, and transitions between sections are made in slide format.

In addition, the entire map or specific sections of it can be converted into different formats and transferred.