
Debugging dataLayer from the console can become tedious. On the storefront, GTM (Google Tag Manager) Preview Mode for dataLayer and typing the relevant variable into the console for everything else can be enough. However, the data in a hit sent to GA4 (Google Analytics 4) or Google Ads can also come from other variables, or an action on the page can change a variable’s value. These may need to be followed in parallel, together with how they change over time.
The platform’s and the tags’ own variables can fall within this tracking too:
window.Shopifyon Shopify, andwindow.globalModel,window.MEMBER_INFOand similar variables on other e-commerce platformswindow.google_tag_datafor the state ofgtag- A queue such as
uetqfor Microsoft Advertising, or a tag management tool’sutag_dataobject - A variable where an app collects its logs
These variables change throughout the page: a new record is added to a queue, a key is added to an object or a value is updated. On platforms like Shopify that run pixels inside a sandbox, part of the records is created in that separate environment and is not visible from the top page.
When I used the existing dataLayer extensions, I found that their interfaces were more polished but they did not fully cover the functionality I needed: they did not support Shopify pixel structures reliably, and they had no features such as separating pushed records by type, grouping them or bringing a new variable into scope. So I wrote a more minimal and functional tool that keeps dataLayer first but follows extra variables, object changes and pixel frames in the same panel: Data Layers Inspector, a Chrome extension. This post covers what the tool reads and what it does not.
Tracking with the Console and Preview
The typical flow on the storefront looks like this: events are checked in Preview Mode, and when needed, dataLayer and other variables such as uetq, utag_data or the site’s own objects are called one by one in the console. Each call shows only the current state; seeing how a variable changes over time means repeating the same step again and again. When the page changes, the previous page’s variables can no longer be read and the same steps start over on the new page. If logs from other sources, JavaScript errors and failed request errors also land in the console, at some point using the console for this tracking stops being practical.
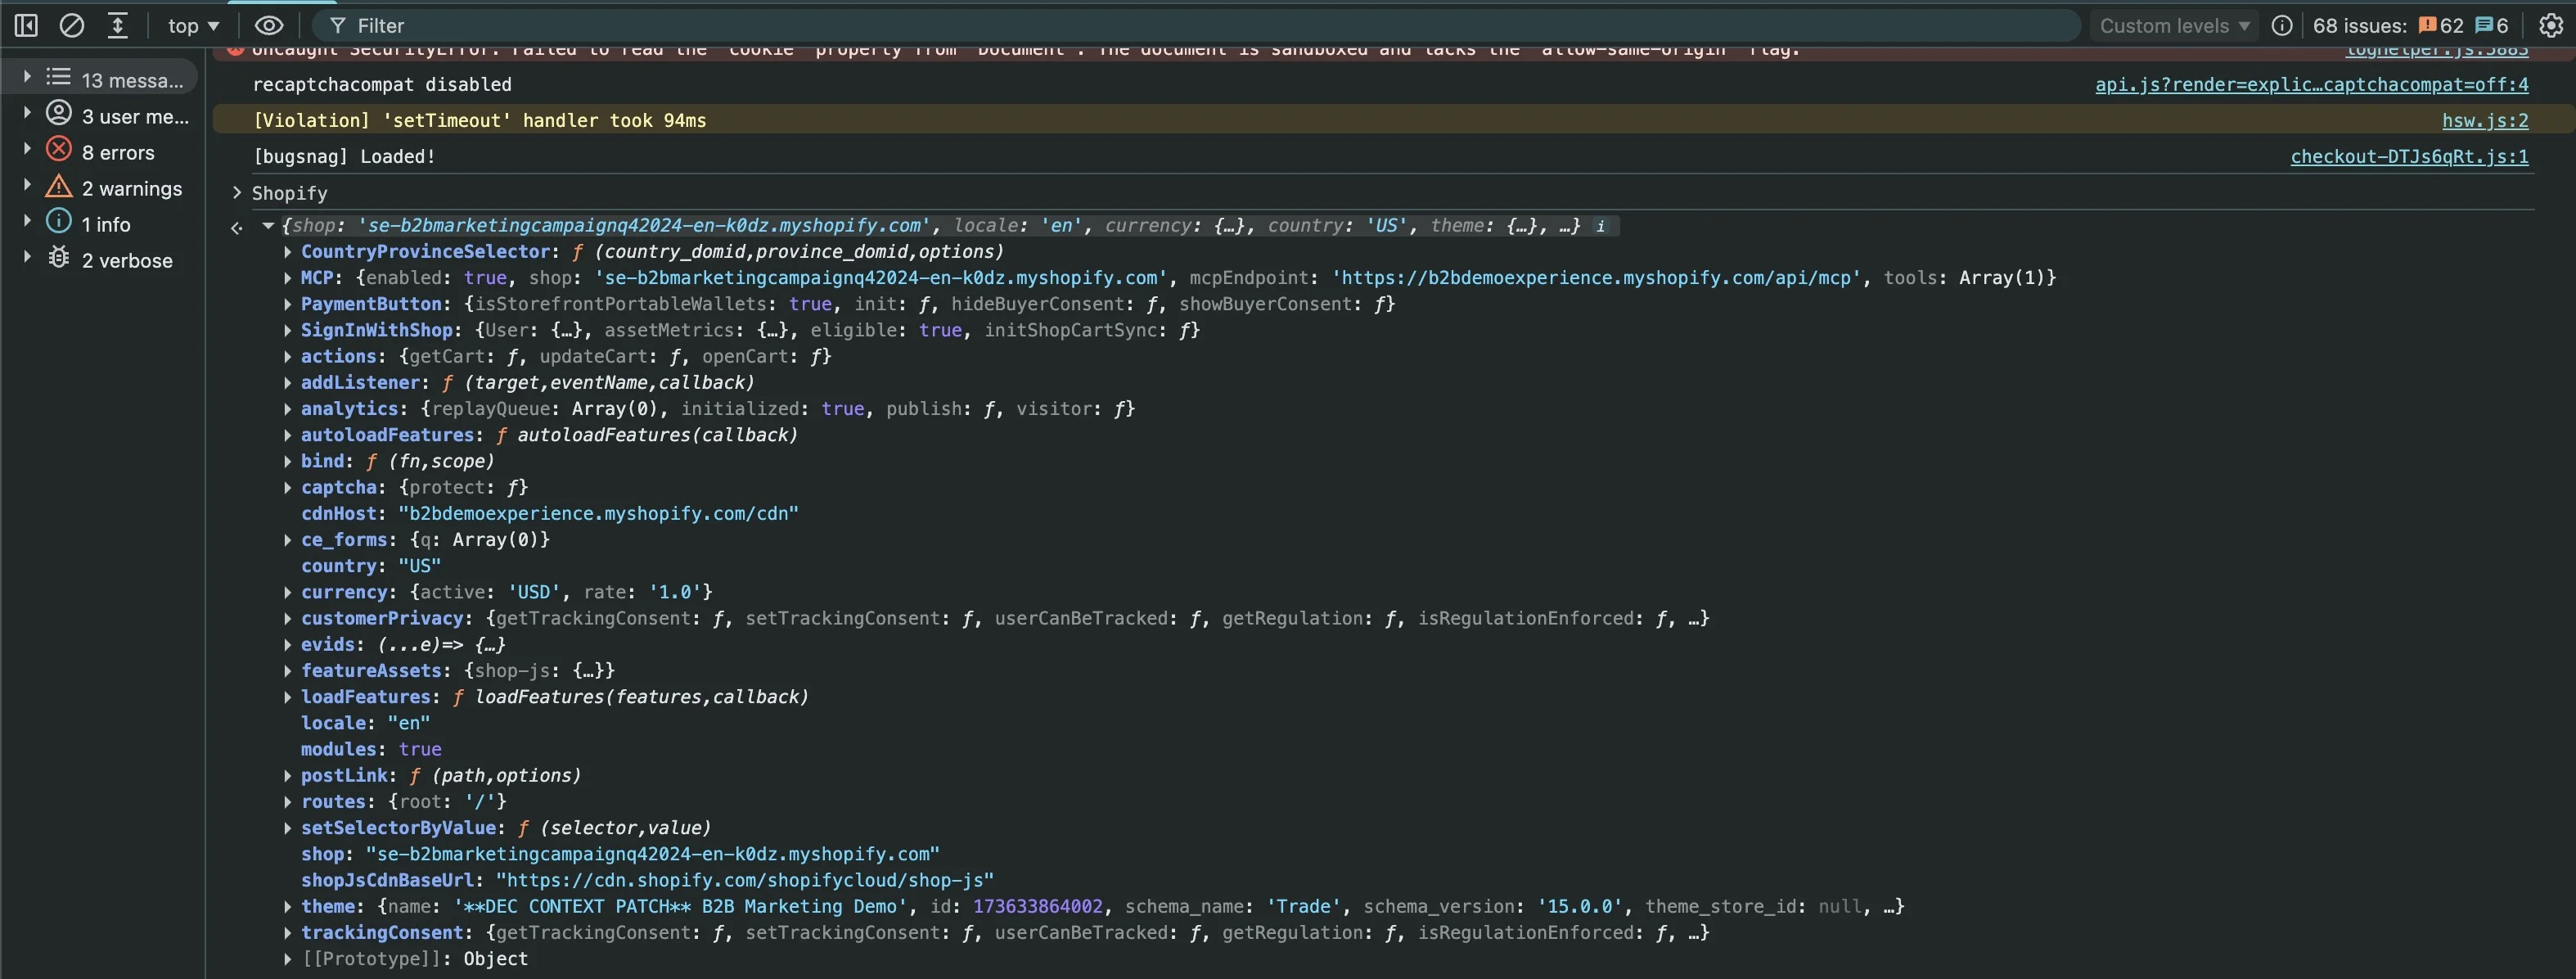
Queues and Objects: What the Extension Reads
dataLayer is an array; every push adds a new record and earlier records stay in place. Extra queues work the same way. With global objects, values are overwritten. So when a change happened, and in which key, cannot be read afterwards. The extension handles the two types separately:
| Type | Example | What it produces in the panel |
|---|---|---|
| Array (queue) | dataLayer, uetq | One push record for each new item |
| Object (snapshot) | utag_data, the site’s own object | An initial view first, then records headed by the keys that changed |
The default array is window.dataLayer. Extra names are entered in Settings; they must be global names defined directly on window, and dotted paths are not supported. Browser objects such as location, localStorage and sessionStorage are refused.
Reading is done by polling: arrays and objects are read every 500 ms. So a change made and reverted between two reads is not visible, and in some fixed-length queues identical consecutive pushes cannot be told apart.
Records in Shopify Pixel Sandboxes
Shopify runs pixels inside either a Lax or a Strict sandbox.1 When GTM is installed in a custom pixel, the container loads inside that sandbox and writes to its own dataLayer. Typing dataLayer into the top page’s console does not show these records. In DevTools, the relevant frame’s context has to be selected first.
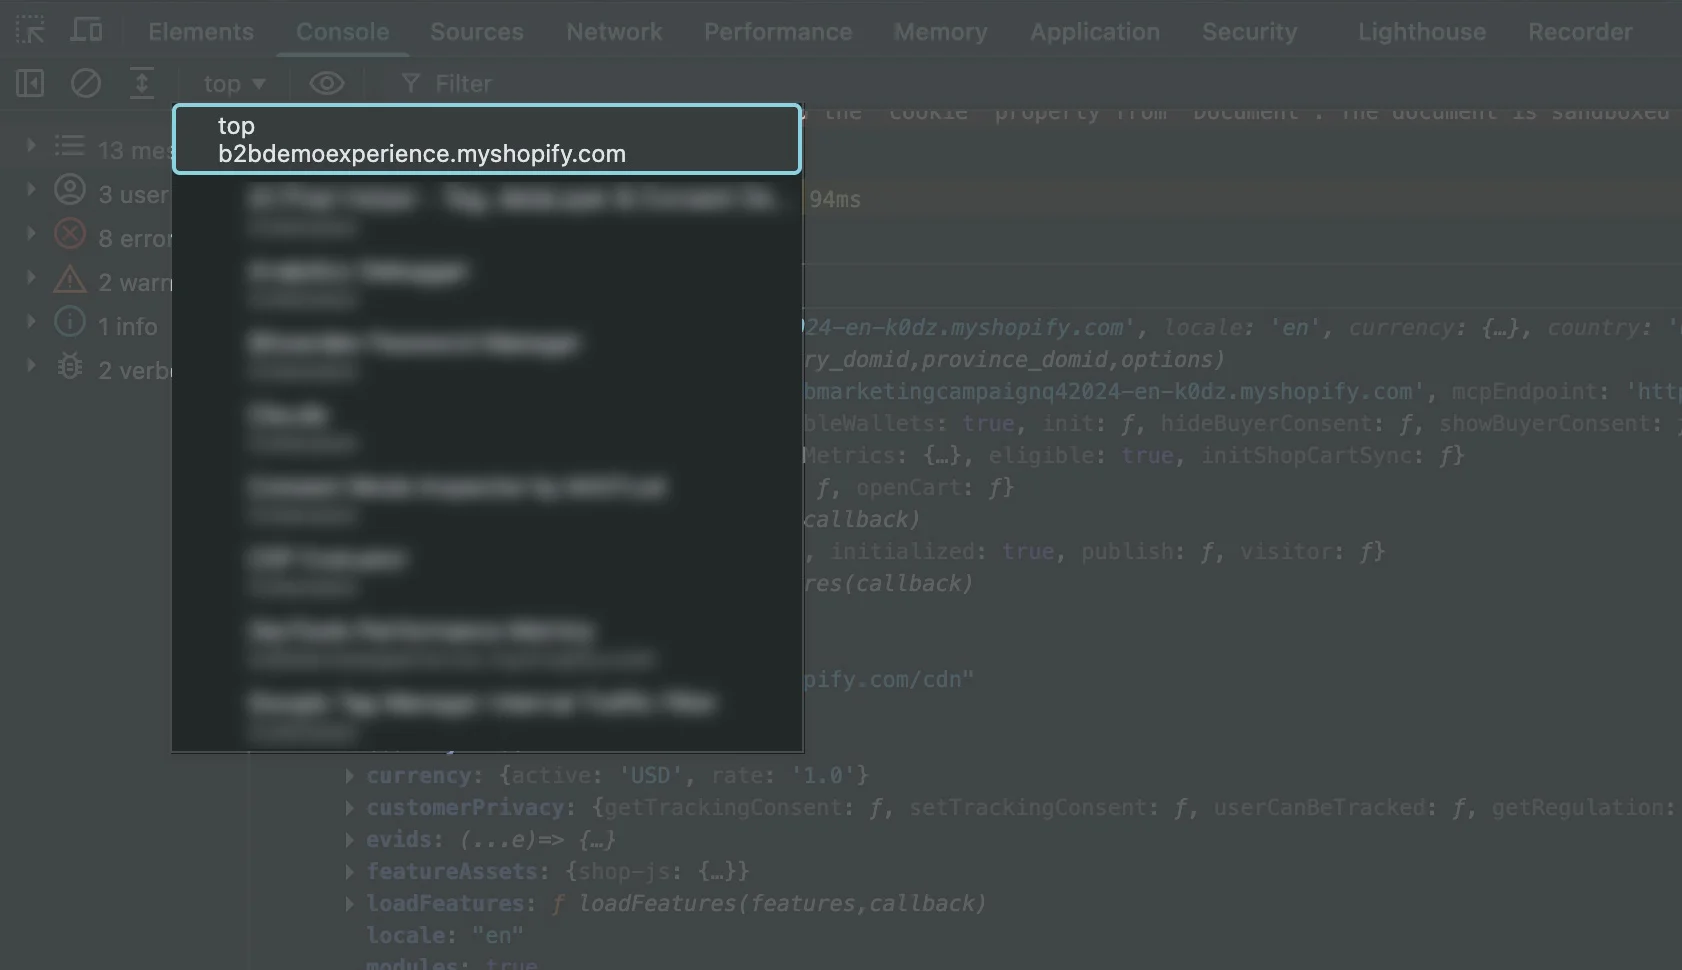
One limitation I have run into on Shopify is that GTM Preview Mode cannot display the dataLayer content running inside a pixel during checkout steps. Some extensions solve this by adding their own GTM snippet to the page. However, this can also mean that some events fire again. Of course, this method is still valid, especially for seeing the results of JavaScript changes made inside GTM. On the other hand, when dataLayer and other variables also need watching, a separate place to check them is needed. After weighing the options, instead of taking that route I wrote a panel that reads each frame’s queues directly. Extensions that add a snippet remain an option to use when needed.
The extension’s panel lists Shopify pixel frames together with the pixel’s name in the Shopify admin. This name is read only from the initialization message the sandbox receives from the top page. The message format is not a documented interface. If Shopify changes it, the name does not come through and the frame label is used instead.
Reading in the Panel: Page, Frame and Record
A recording session is started on a site: the extension does not request access to all sites at installation. In the panel, the disclosure is read, permission for that HTTPS site is granted with Allow and start recording, and the tab reloads. The session applies only to that tab and the permitted frames in it.
In the panel, page and frame are selected separately; the frame list shows container IDs. Records are kept page by page, so history across pages is not lost during checkout. When a record is opened its content is listed; config and get IDs, send_to targets and container IDs appear as badges.
Tools that speed up reading:
- Filters:
Events,Consent,ConfigandLifecyclework on the record’s raw command or event type. - Search: works on titles and content; when a match is on another page or frame, the selectors show it too.
- Grouping: combines consecutive records with the same title.
Pause: freezes the visible list while the recording session continues in the background.
A record cannot always be stored in full. Depth limits, long strings or unreadable values can cause cuts; in that case the panel shows a note at the place of the cut. Not presenting incomplete data as complete is necessary to avoid a wrong diagnosis.
Together with Inspect Signals
I use the two extensions together, because they answer different questions:
| Question | Tool |
|---|---|
| What data did the site push, what changed in the object? | Data Layers Inspector |
| Which request did the browser send to Google? | Inspect Signals |
When value is wrong in a purchase hit, I first use Inspect Signals to see which layer the hit came from, and then Data Layers Inspector to look at the record pushed in that layer’s frame. If the value in the record is correct, the problem most likely lies in the tag configuration; if it is wrong, in the source of the data.
Data Layers Inspector does not act on the GTM container; it does not show tags, triggers or GTM variables.
Masking and Retention
Measurement data can carry personal data. Known personal keys, user_data and address subtrees, and email patterns are masked before storage. Query strings and the part of the address after # are removed from page labels. Masking works on a best-effort basis and is not anonymization; an unrecognized personal value can remain.
Raw values are turned on separately for each recording session, and every Start turns raw mode off again. Records are kept in the browser’s session memory and deleted when the tab closes. Each frame keeps at most 500 records, and tabs and frames share a budget of approximately 8 MB. When old records are trimmed, the number of dropped records is visible in the panel. Export writes the selected page and frame’s log as JSON.
Limits and Decisions
- The extension shows what was pushed, not which tag fired. I solve that with other extensions. Whether to add this as a feature is not entirely clear to me yet. If I can define a different context for it, it can of course be added.
- Pixels running inside a worker in the Strict sandbox are outside this reader; only frames with HTTPS addresses are read.
- A frame on another domain needs a separate grant for that domain;
about:blank,data:andblob:documents are not read. - The page’s own JavaScript can create or change records; the panel is not an audit log but a debugging view.
- The pixel name depends on Shopify’s undocumented initialization message; if the format changes, the name is not shown.
Related Posts
- Tracing the Source of GA4 and Ads Signals in Shopify
- How dataLayer Works: The Shared Layer for GTM, gtag.js, and Consent Mode
- Bridging Shopify Metafields and Custom Pixel: The Cart Attribute Pattern
- Google Ads Conversion Double Counting on Shopify: Diagnosis with the Webpages Report and the Checkout Token
Project page of a Chrome extension that shows changes in dataLayer, extra event queues and selected global objects, Shopify pixel sandboxes included, per page and per frame in Chrome's side panel.
Go to Project PageFootnotes
- Web Pixels API (Shopify). “For app developers integrating app web pixels, pixels are loaded in a strict sandbox.” The page also states that pixels run within “one of our Lax or Strict sandboxes”. ↩
- 01 The console and Preview Mode can read
dataLayer, but extra queues such asuetqand global objects such asutag_datahave to be called one by one on every page; the extension keeps them in one panel, per page and per frame. - 02 Arrays produce push records; objects produce an initial view followed by records headed by the keys that changed.
- 03 Shopify custom pixels run in a separate sandbox frame; that frame's dataLayer is not visible from the top page's console and is read by selecting the frame.
- 04 The extension shows what was pushed, not which tag fired; it can be used together with Inspect Signals for the requests the browser sends.
- 05 Masking is on by default in every recording session and works on a best-effort basis; raw values are turned on separately for each session.
+ Why doesn't the dataLayer inside a Shopify custom pixel show up in the top page's console?
Custom pixel code runs in a separate sandbox iframe with its own window object. The top page's window.dataLayer is not that frame's array. Seeing the records requires selecting that frame's context in DevTools or using a tool that reads per frame.
+ Does Data Layers Inspector show whether GTM tags fired?
No. The extension shows the records the site pushed and the changes to selected objects. The state of tags, triggers and GTM variables is Preview Mode's job; for the requests the browser sends, Inspect Signals can be used.
+ Which extra queues or objects can be watched?
Up to 20 global names defined directly on window can be added in Settings, for example uetq or utag_data. Dotted paths are not supported; browser objects such as location, localStorage and sessionStorage are refused.
+ Is the recorded data sent anywhere?
No. The extension has no server, analytics or remote code. Records are kept in the browser's session memory and deleted when the tab or the browser closes. Export writes a file only when the Export button is pressed.